Data visualization tools in Dynamics 365: Dashboards/Views/Charts
Do you find that the data shown in your Dynamics 365 environment is not reflective of the business data which is relevant to you? There are a variety of out of the box tools in Dynamics 365 which can be used to achieve this vital need. Such tools include Views and Charts which can be brought together into Dashboards to give an overview of data components captured in Dynamics 365.
For Dashboards, Views, and Charts there are two definitive types, Personal and System.
Personal Dashboards/Views/Charts
You, and anyone else, who has at least User level access to the system can build their own personal dashboards, views and charts based on their privileges in the system. The system administrator can modify the access level for each action in the security role to control the depth to which people can create, read, write, delete, assign, or share personal views.
All three components are owned by individuals and because of their default User level access, they are visible only to that person or anyone else they choose to share them with.
System Dashboards/Views/Charts
As a system administrator or system customizer, you can create and edit system dashboards, views or charts. System Views and Charts are viewable by all users who have access to the system, while System Dashboards can have controlled access by associating explicit security roles.
Views
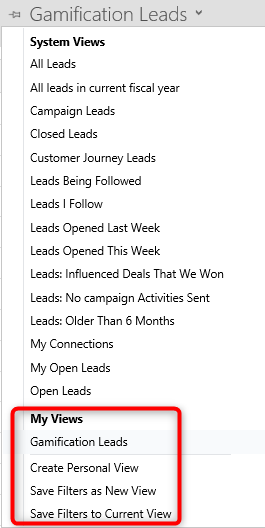
Views define how a list of records for a specific entity are displayed in the application. A variety of views are available to select from right out of the box, and their variance is based on the filtered criteria which has been defined. Click the drop-down arrow next to a view name to reveal the additional views you can select from.

Personal Views
You can create personal views by saving a query that you define by using Advanced Find or by using the Save Filters as New Views and Save Filters to Current View options in the list of views. These options and saved Personal Views are included at the bottom of system views in the application. Do note, that while you can create a new personal view based on a system view, you cannot create a system view based on a personal view.
System Views
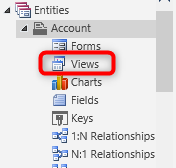
A System Administrator or System Customizer can create and modify system views by navigating to the organizations solution, and selecting an entity to modify or create a view for. These are viewable by all users who have access to the system.
Want to learn more about creating Personal Views? Check out our blog.
Charts
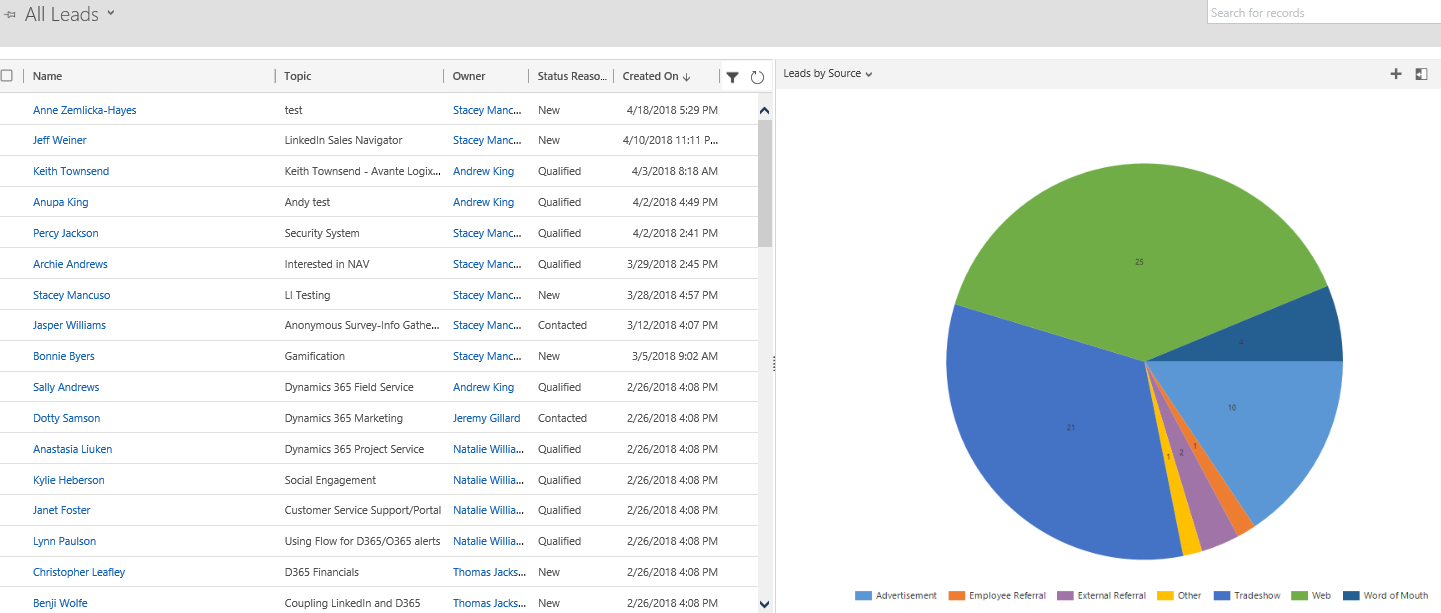
A chart is a graphic representation of data from multiple records of an entity. Charts interact with the views and filters which are currently applied to the active view and a chart is refreshed each time you change your view. So, if viewing My Leads, the chart will depict that information, if you switch the view to All Leads, the Chart will change to reflect the data of the newly selected View.
From a View, refer to the righthand side of the window to expand and collapse the Chart pane. Click the drop-down arrow next to a chart name to reveal the additional charts you can select from.
Personal Charts
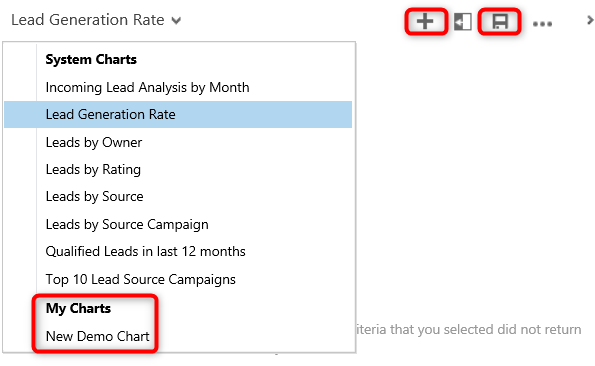
You can create personal charts by performing a “save as” on an existing chart or create a new chart from scratch. These options are included in the chart toolbar and your saved personal charts will display beneath the system charts. Do note, that while you can create a new personal chart based on a system chart, you cannot create a system chart based on a personal chart.
System Charts
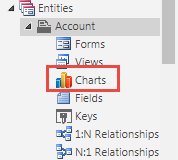
A System Administrator or System Customizer can create and modify system charts by navigating to the organizations solution, and selecting an entity to modify or create a chart for. These are viewable by all users who have access to the system.
Want to learn more about creating Personal Charts? Check out our blog.
Dashboards
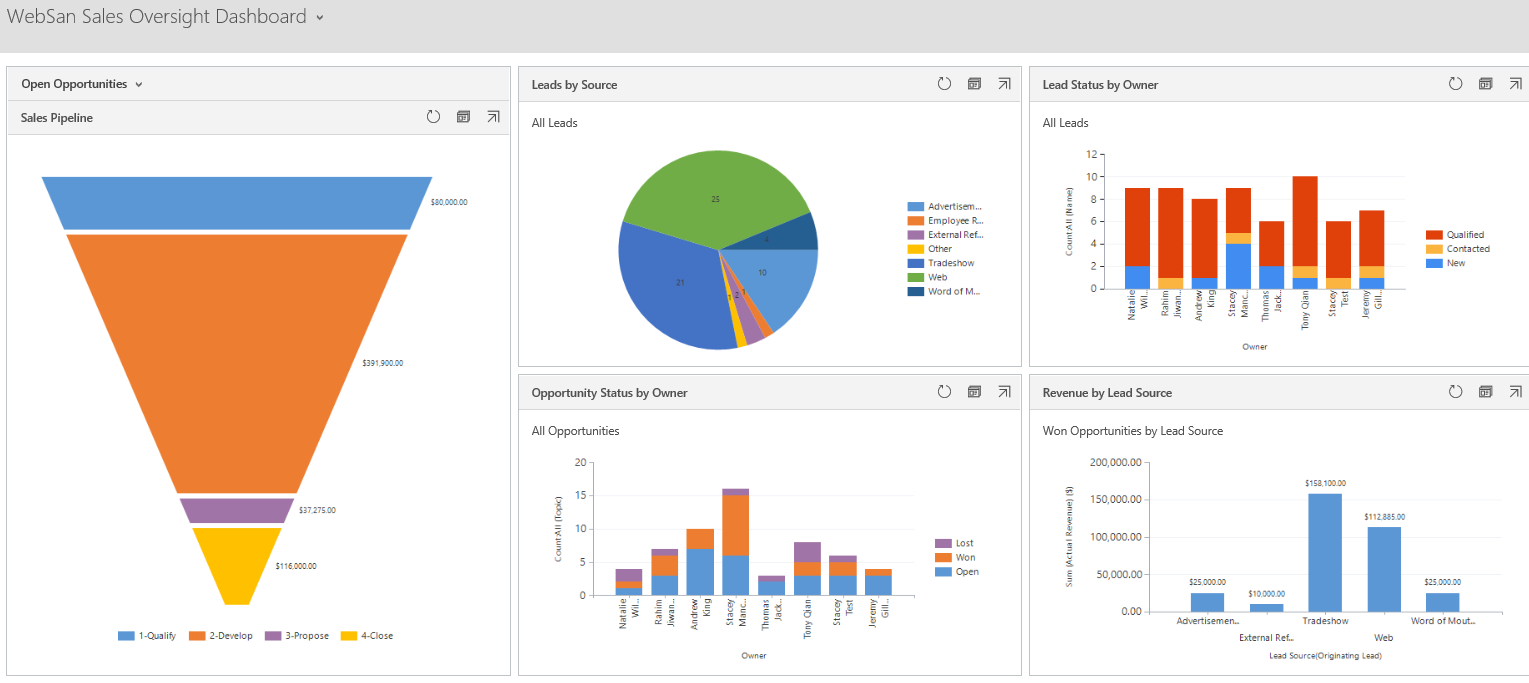
Dashboards are collections of views, charts, web resources, and iFrames, which display key metrics which are vital to your organization. Click the drop-down arrow next to a dashboard name to reveal the additional dashboards you can select from.
Personal Dashboards
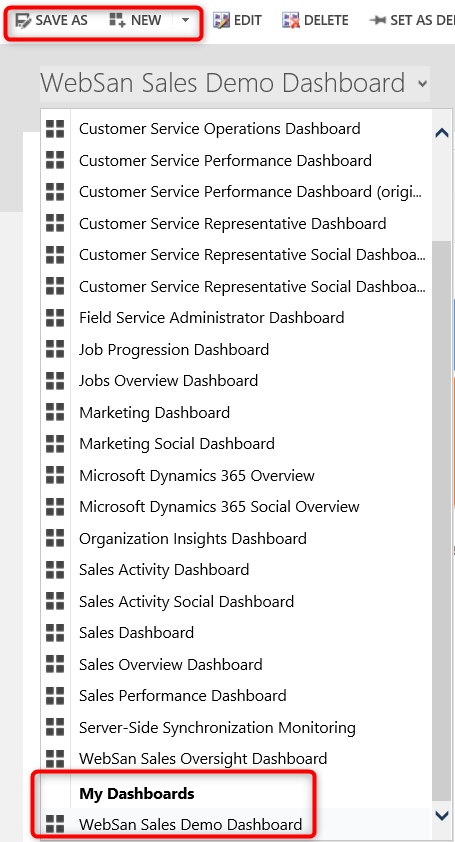
A personal dashboard allows you to design a dashboard which is unique to you, displaying the views and/or charts which contain the information which your world revolves around. You can choose from both System and Personal Views and Charts to incorporate into your Dashboard. Create personal dashboards by performing a “save as” on an existing dashboard or create a new dashboard from scratch. These options are included in the dashboard toolbar and your saved personal dashboards will display beneath the system dashboards. Do note, that while you can create a new personal dashboard based on a system dashboard, you cannot create a system dashboard based on a personal dashboard.
System Dashboards
A System Administrator or System Customizer can create and modify system dashboards by navigating to the organizations solution, and selecting Dashboards to modify or create a chart for. Unlike Views and Charts, you can control the visibility of Dashboards by selecting a Dashboard and clicking on Enable Security Roles.

Want to learn more about creating Personal Dashboards? Check out our blog.
If you need assistance or have any questions about Views. Charts or Dashboards, please reach out to our support team at